32 7.2 Valence Bond Theory
Learning Objectives
By the end of this section, you will be able to:
- Describe the formation of covalent bonds in terms of atomic orbital overlap
- Define and give examples of σ and π bonds
As we know, a scientific theory is a strongly supported explanation for observed natural laws or large bodies of experimental data. For a theory to be accepted, it must explain experimental data and be able to predict behavior. For example, VSEPR theory has gained widespread acceptance because it predicts three-dimensional molecular shapes that are consistent with experimental data collected for thousands of different molecules. However, VSEPR theory does not provide an explanation of chemical bonding.
There are successful theories that describe the electronic structure of atoms. We can use quantum mechanics to predict the specific regions around an atom where electrons are likely to be located: A spherical shape for an s orbital, a dumbbell shape for a p orbital, and so forth. However, these predictions only describe the orbitals around free atoms. When atoms bond to form molecules, atomic orbitals are not sufficient to describe the regions where electrons will be located in the molecule. A more complete understanding of electron distributions requires a model that can account for the electronic structure of molecules. One popular theory holds that a covalent bond forms when a pair of electrons is shared by two atoms and is simultaneously attracted by the nuclei of both atoms. In the following sections, we will discuss how such bonds are described by valence bond theory and hybridization.
Valence bond theory describes a covalent bond as the overlap of half-filled atomic orbitals (each containing a single electron) that yield a pair of electrons shared between the two bonded atoms. We say that orbitals on two different atoms overlap when a portion of one orbital and a portion of a second orbital occupy the same region of space. According to valence bond theory, a covalent bond results when two conditions are met: (1) an orbital on one atom overlaps an orbital on a second atom and (2) the single electrons in each orbital combine to form an electron pair. The mutual attraction between this negatively charged electron pair and the two atoms’ positively charged nuclei serves to physically link the two atoms through a force we define as a covalent bond. The strength of a covalent bond depends on the extent of overlap of the orbitals involved. Orbitals that overlap extensively form bonds that are stronger than those that have less overlap.
The energy of the system depends on how much the orbitals overlap. Figure 1 illustrates how the sum of the energies of two hydrogen atoms (the colored curve) changes as they approach each other. When the atoms are far apart there is no overlap, and by convention we set the sum of the energies at zero. As the atoms move together, their orbitals begin to overlap. Each electron begins to feel the attraction of the nucleus in the other atom. In addition, the electrons begin to repel each other, as do the nuclei. While the atoms are still widely separated, the attractions are slightly stronger than the repulsions, and the energy of the system decreases. (A bond begins to form.) As the atoms move closer together, the overlap increases, so the attraction of the nuclei for the electrons continues to increase (as do the repulsions among electrons and between the nuclei). At some specific distance between the atoms, which varies depending on the atoms involved, the energy reaches its lowest (most stable) value. This optimum distance between the two bonded nuclei is the bond distance between the two atoms. The bond is stable because at this point, the attractive and repulsive forces combine to create the lowest possible energy configuration. If the distance between the nuclei were to decrease further, the repulsions between nuclei and the repulsions as electrons are confined in closer proximity to each other would become stronger than the attractive forces. The energy of the system would then rise (making the system destabilized), as shown at the far left of Figure 1.
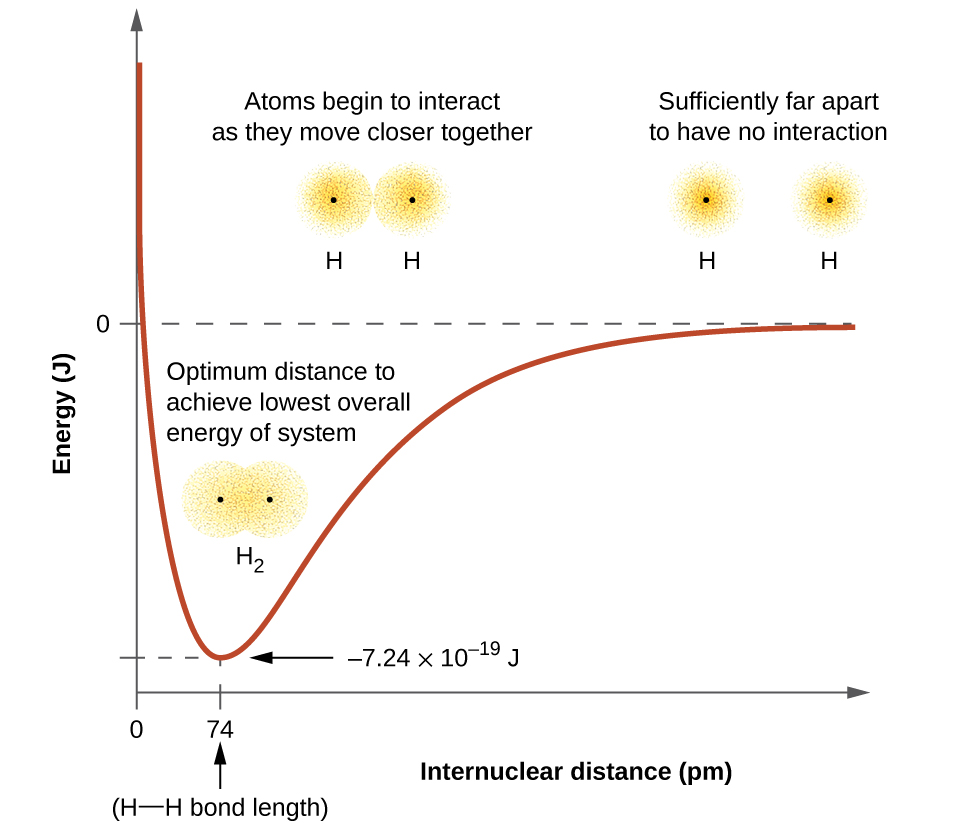
The bond energy is the difference between the energy minimum (which occurs at the bond distance) and the energy of the two separated atoms. This is the quantity of energy released when the bond is formed. Conversely, the same amount of energy is required to break the bond. For the H2 molecule shown in Figure 1, at the bond distance of 74 pm the system is 7.24 × 10⁻¹⁹ J lower in energy than the two separated hydrogen atoms. This may seem like a small number. However, we know from our earlier description of thermochemistry that bond energies are often discussed on a per-mole basis. For example, it requires 7.24 × 10⁻¹⁹ J to break one H–H bond, but it takes 4.36 × 10⁵ J to break 1 mole of H–H bonds. A comparison of some bond lengths and energies is shown in Table 1. We can find many of these bonds in a variety of molecules, and this table provides average values. For example, breaking the first C–H bond in CH4 requires 439.3 kJ/mol, while breaking the first C–H bond in H–CH2C6H5 (a common paint thinner) requires 375.5 kJ/mol.
| Bond | Length (pm) | Energy (kJ/mol) | Bond | Length (pm) | Energy (kJ/mol) | |
|---|---|---|---|---|---|---|
| H–H | 74 | 436 | C–O | 140.1 | 358 | |
| H–C | 106.8 | 413 | C=O | 119.7 | 745 | |
| H–N | 101.5 | 391 | C≡O | 113.7 | 1072 | |
| H–O | 97.5 | 467 | H–Cl | 127.5 | 431 | |
| C–C | 150.6 | 347 | H–Br | 141.4 | 366 | |
| C=C | 133.5 | 614 | H–I | 160.9 | 298 | |
| C≡C | 120.8 | 839 | O–O | 148 | 146 | |
| C–N | 142.1 | 305 | O=O | 120.8 | 498 | |
| C=N | 130.0 | 615 | F–F | 141.2 | 159 | |
| C≡N | 116.1 | 891 | Cl–Cl | 198.8 | 243 | |
| Table 1. Representative Bond Energies and Lengths | ||||||
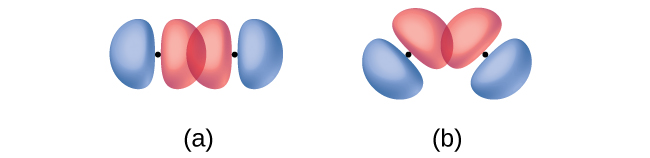
In addition to the distance between two orbitals, the orientation of orbitals also affects their overlap (other than for two s orbitals, which are spherically symmetric). Greater overlap is possible when orbitals are oriented such that they overlap on a direct line between the two nuclei. Figure 2 illustrates this for two p orbitals from different atoms; the overlap is greater when the orbitals overlap end to end rather than at an angle.
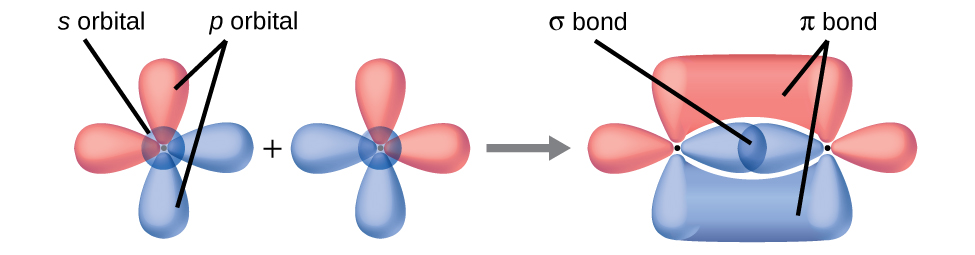
The overlap of two s orbitals (as in H2), the overlap of an s orbital and a p orbital (as in HCl), and the end-to-end overlap of two p orbitals (as in Cl2) all produce sigma bonds (σ bonds), as illustrated in Figure 3. A σ bond is a covalent bond in which the electron density is concentrated in the region along the internuclear axis; that is, a line between the nuclei would pass through the center of the overlap region. Single bonds in Lewis structures are described as σ bonds in valence bond theory.
A pi bond (π bond) is a type of covalent bond that results from the side-by-side overlap of two p orbitals, as illustrated in Figure 4. In a π bond, the regions of orbital overlap lie on opposite sides of the internuclear axis. Along the axis itself, there is a node, that is, a plane with no probability of finding an electron.

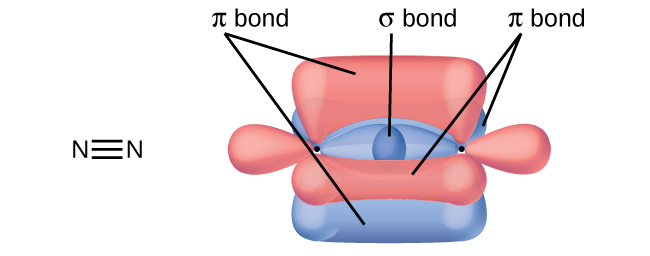
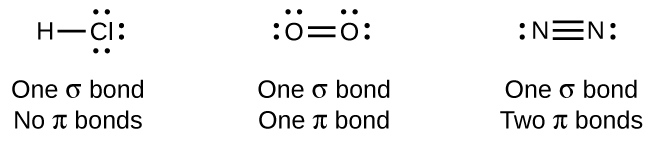
While all single bonds are σ bonds, multiple bonds consist of both σ and π bonds. As the Lewis structures in suggest, O2 contains a double bond, and N2 contains a triple bond. The double bond consists of one σ bond and one π bond, and the triple bond consists of one σ bond and two π bonds. Between any two atoms, the first bond formed will always be a σ bond, but there can only be one σ bond in any one location. In any multiple bond, there will be one σ bond, and the remaining one or two bonds will be π bonds. These bonds are described in more detail later in this chapter.
As seen in Table 1, an average carbon-carbon single bond is 347 kJ/mol, while in a carbon-carbon double bond, the π bond increases the bond strength by 267 kJ/mol. Adding an additional π bond causes a further increase of 225 kJ/mol. We can see a similar pattern when we compare other σ and π bonds. Thus, each individual π bond is generally weaker than a corresponding σ bond between the same two atoms. In a σ bond, there is a greater degree of orbital overlap than in a π bond.
Example 1
Counting σ and π Bonds
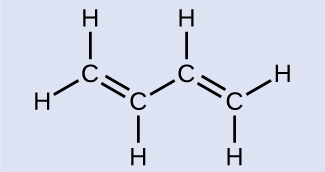
Butadiene, C6H6, is used to make synthetic rubber. Identify the number of σ and π bonds contained in this molecule.
Solution
There are six σ C–H bonds and one σ C–C bond, for a total of seven from the single bonds. There are two double bonds that each have a π bond in addition to the σ bond. This gives a total nine σ and two π bonds overall.
Check Your Learning
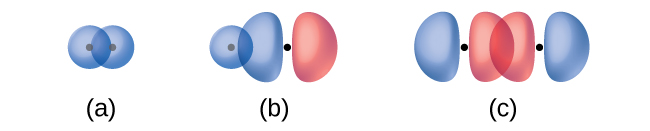
Identify each illustration as depicting a σ or π bond:
(a) side-by-side overlap of a 4p and a 2p orbital
(b) end-to-end overlap of a 4p and 4p orbital
(c) end-to-end overlap of a 4p and a 2p orbital

Answer:
(a) is a π bond with a node along the axis connecting the nuclei while (b) and (c) are σ bonds that overlap along the axis.
Key Concepts and Summary
Valence bond theory describes bonding as a consequence of the overlap of two separate atomic orbitals on different atoms that creates a region with one pair of electrons shared between the two atoms. When the orbitals overlap along an axis containing the nuclei, they form a σ bond. When they overlap in a fashion that creates a node along this axis, they form a π bond.
Chemistry End of Chapter Exercises
- Explain how σ and π bonds are similar and how they are different.
- Draw a curve that describes the energy of a system with H and Cl atoms at varying distances. Then, find the minimum energy of this curve two ways.
(a) Use the bond energy found in Table 1 to calculate the energy for one single HCl bond (Hint: How many bonds are in a mole?)
(b) Use the enthalpy of reaction and the bond energies for H2 and Cl2 to solve for the energy of one mole of HCl bonds.
[latex]\text{H}_2(g) + \text{Cl}_2(g) \rightleftharpoons 2 \text{HCl}(g) \;\;\;\;\; {\Delta}H^{\circ}_{\text{rxn}} = -184.7 \;\text{kJ/mol}[/latex] - Explain why bonds occur at specific average bond distances instead of the atoms approaching each other infinitely close.
- Use valence bond theory to explain the bonding in F2, HF, and ClBr. Sketch the overlap of the atomic orbitals involved in the bonds.
- Use valence bond theory to explain the bonding in O2. Sketch the overlap of the atomic orbitals involved in the bonds in O2.
- How many σ and π bonds are present in the molecule HCN?
- A friend tells you N2 has three π bonds due to overlap of the three p-orbitals on each N atom. Do you agree?
- Draw the Lewis structures for CO2 and CO, and predict the number of σ and π bonds for each molecule.
(a) CO2
(b) CO
Glossary
- overlap
- coexistence of orbitals from two different atoms sharing the same region of space, leading to the formation of a covalent bond
- node
- plane separating different lobes of orbitals, where the probability of finding an electron is zero
- pi bond (π bond)
- covalent bond formed by side-by-side overlap of atomic orbitals; the electron density is found on opposite sides of the internuclear axis
- sigma bond (σ bond)
- covalent bond formed by overlap of atomic orbitals along the internuclear axis
- valence bond theory
- description of bonding that involves atomic orbitals overlapping to form σ or π bonds, within which pairs of electrons are shared
Solutions
Answers to Chemistry End of Chapter Exercises
1. Similarities: Both types of bonds result from overlap of atomic orbitals on adjacent atoms and contain a maximum of two electrons. Differences: σ bonds are stronger and result from end-to-end overlap and all single bonds are σ bonds; π bonds between the same two atoms are weaker because they result from side-by-side overlap, and multiple bonds contain one or more π bonds (in addition to a σ bond).
3. The specific average bond distance is the distance with the lowest energy. At distances less than the bond distance, the positive charges on the two nuclei repel each other, and the overall energy increases.
5. Bonding: One σ bond and one π bond. The s orbitals are filled and do not overlap. The p orbitals overlap along the axis to form a σ bond and side-by-side to form the π bond.
7. No, two of the p orbitals (one on each N) will be oriented end-to-end and will form a σ bond.