86 15.7 Catalysis
Learning Objectives
- Explain the function of a catalyst in terms of reaction mechanisms and potential energy diagrams
- List examples of catalysis in natural and industrial processes
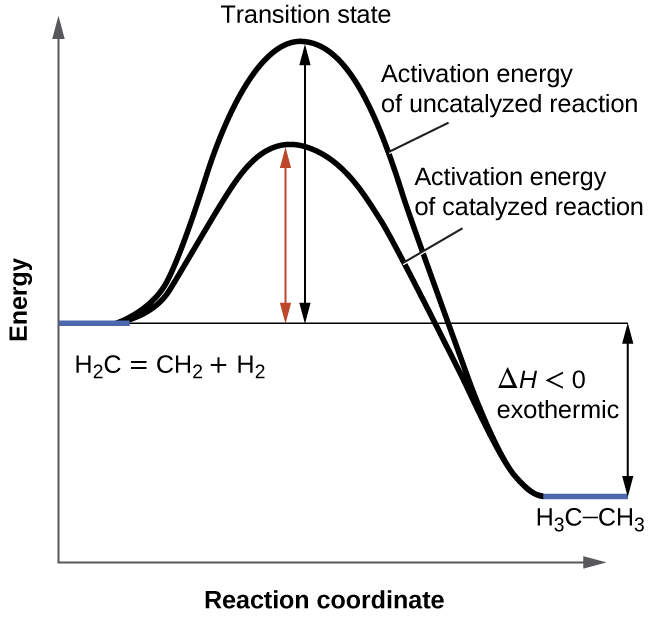
We have seen that the rate of many reactions can be accelerated by catalysts. A catalyst speeds up the rate of a reaction by lowering the activation energy; in addition, the catalyst is regenerated in the process. Several reactions that are thermodynamically favorable in the absence of a catalyst only occur at a reasonable rate when a catalyst is present. One such reaction is catalytic hydrogenation, the process by which hydrogen is added across an alkene C=C bond to afford the saturated alkane product. A comparison of the reaction coordinate diagrams (also known as energy diagrams) for catalyzed and uncatalyzed alkene hydrogenation is shown in Figure 1.
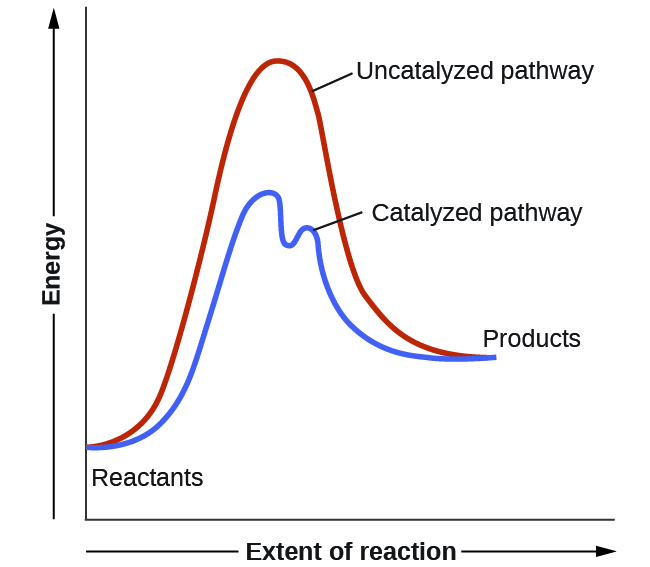
Catalysts function by providing an alternate reaction mechanism that has a lower activation energy than would be found in the absence of the catalyst. In some cases, the catalyzed mechanism may include additional steps, as depicted in the reaction diagrams shown in Figure 2. This lower activation energy results in an increase in rate as described by the Arrhenius equation. Note that a catalyst decreases the activation energy for both the forward and the reverse reactions and hence accelerates both the forward and the reverse reactions. Consequently, the presence of a catalyst will permit a system to reach equilibrium more quickly, but it has no effect on the position of the equilibrium as reflected in the value of its equilibrium constant (see the later chapter on chemical equilibrium).
Example 1
Using Reaction Diagrams to Compare Catalyzed Reactions
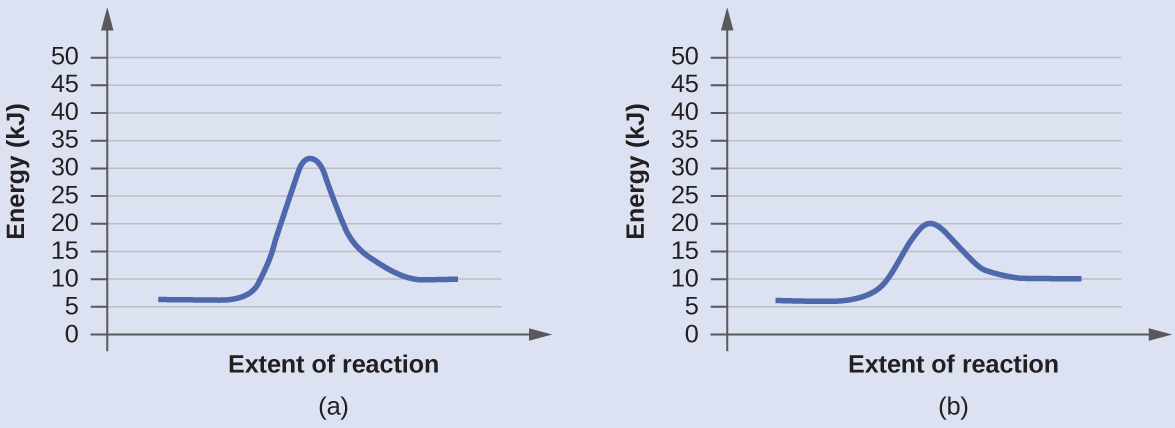
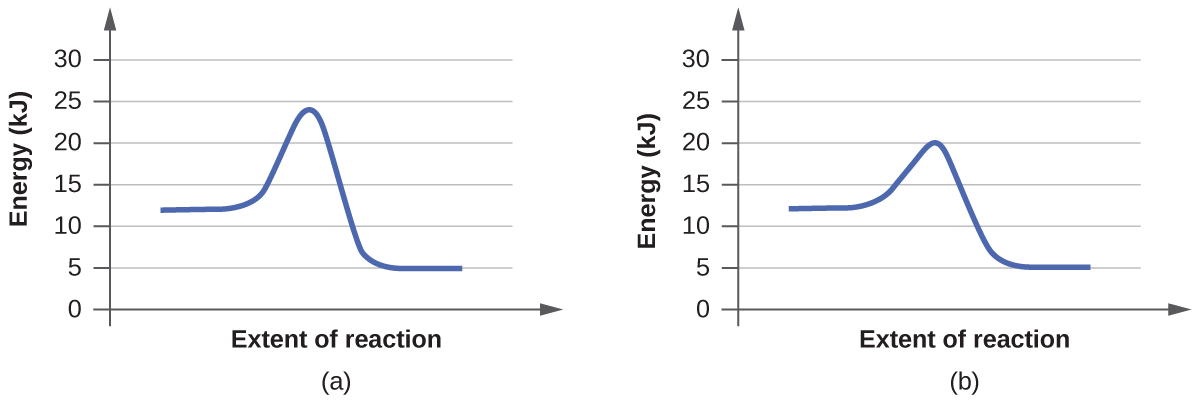
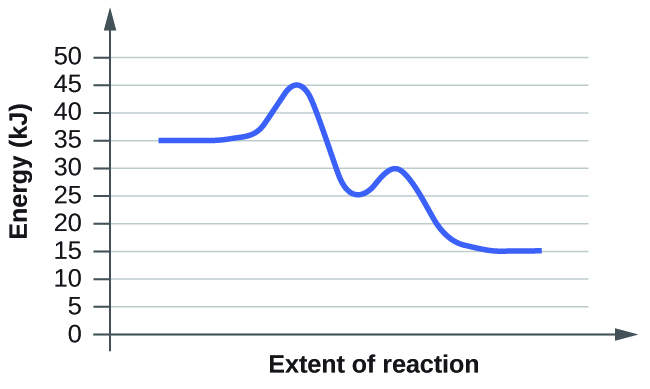
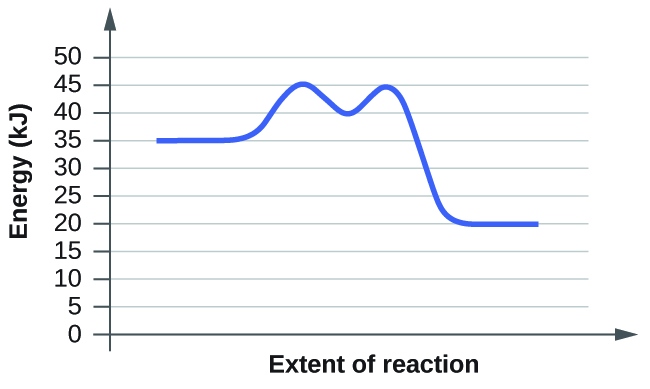
The two reaction diagrams here represent the same reaction: one without a catalyst and one with a catalyst. Identify which diagram suggests the presence of a catalyst, and determine the activation energy for the catalyzed reaction:
Solution
A catalyst does not affect the energy of reactant or product, so those aspects of the diagrams can be ignored; they are, as we would expect, identical in that respect. There is, however, a noticeable difference in the transition state, which is distinctly lower in diagram (b) than it is in (a). This indicates the use of a catalyst in diagram (b). The activation energy is the difference between the energy of the starting reagents and the transition state—a maximum on the reaction coordinate diagram. The reagents are at 6 kJ and the transition state is at 20 kJ, so the activation energy can be calculated as follows:
Check Your Learning
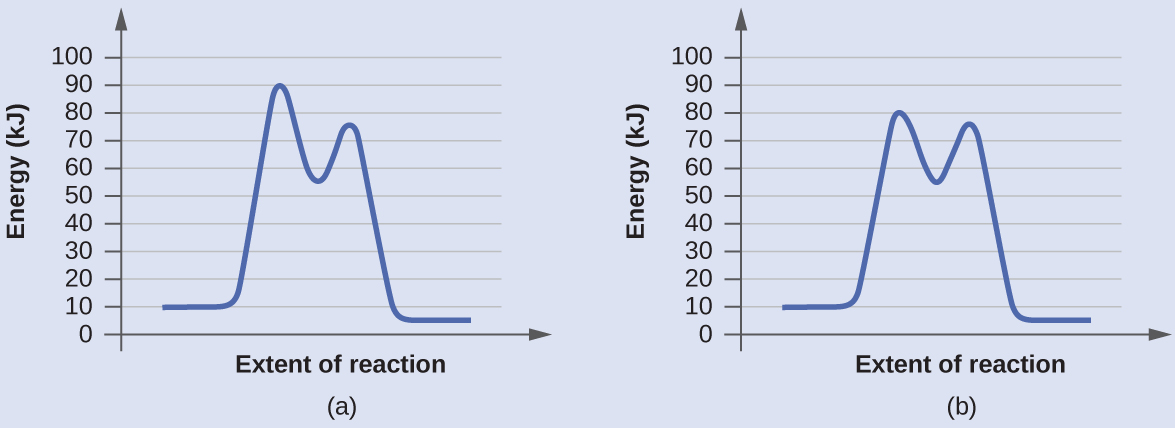
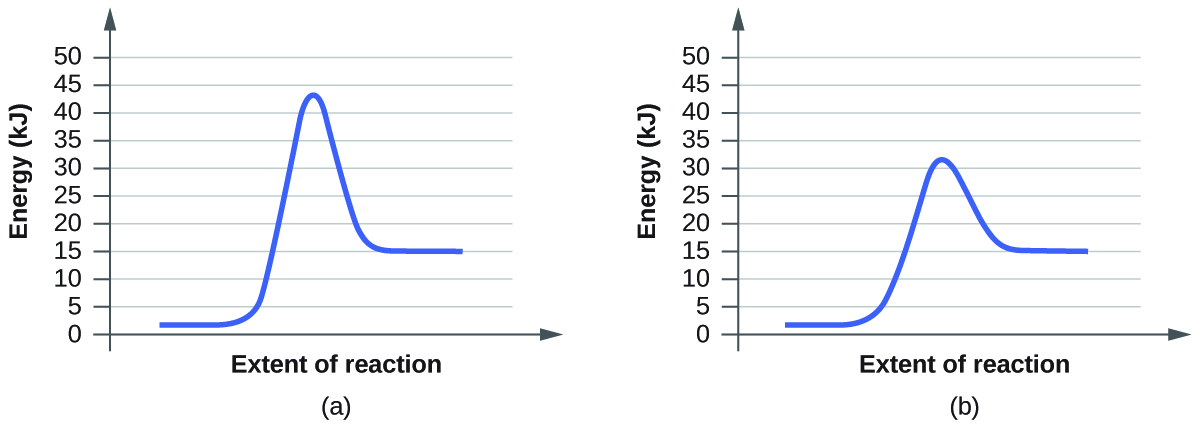
Determine which of the two diagrams here (both for the same reaction) involves a catalyst, and identify the activation energy for the catalyzed reaction:
Answer:
Diagram (b) is a catalyzed reaction with an activation energy of about 70 kJ.
Homogeneous Catalysts
A homogeneous catalyst is present in the same phase as the reactants. It interacts with a reactant to form an intermediate substance, which then decomposes or reacts with another reactant in one or more steps to regenerate the original catalyst and form product.
As an important illustration of homogeneous catalysis, consider the earth’s ozone layer. Ozone in the upper atmosphere, which protects the earth from ultraviolet radiation, is formed when oxygen molecules absorb ultraviolet light and undergo the reaction:
Ozone is a relatively unstable molecule that decomposes to yield diatomic oxygen by the reverse of this equation. This decomposition reaction is consistent with the following mechanism:
The presence of nitric oxide, NO, influences the rate of decomposition of ozone. Nitric oxide acts as a catalyst in the following mechanism:
The overall chemical change for the catalyzed mechanism is the same as:
The nitric oxide reacts and is regenerated in these reactions. It is not permanently used up; thus, it acts as a catalyst. The rate of decomposition of ozone is greater in the presence of nitric oxide because of the catalytic activity of NO. Certain compounds that contain chlorine also catalyze the decomposition of ozone.
Mario J. Molina
The 1995 Nobel Prize in Chemistry was shared by Paul J. Crutzen, Mario J. Molina (Figure 3), and F. Sherwood Rowland “for their work in atmospheric chemistry, particularly concerning the formation and decomposition of ozone.”[1] Molina, a Mexican citizen, carried out the majority of his work at the Massachusetts Institute of Technology (MIT).
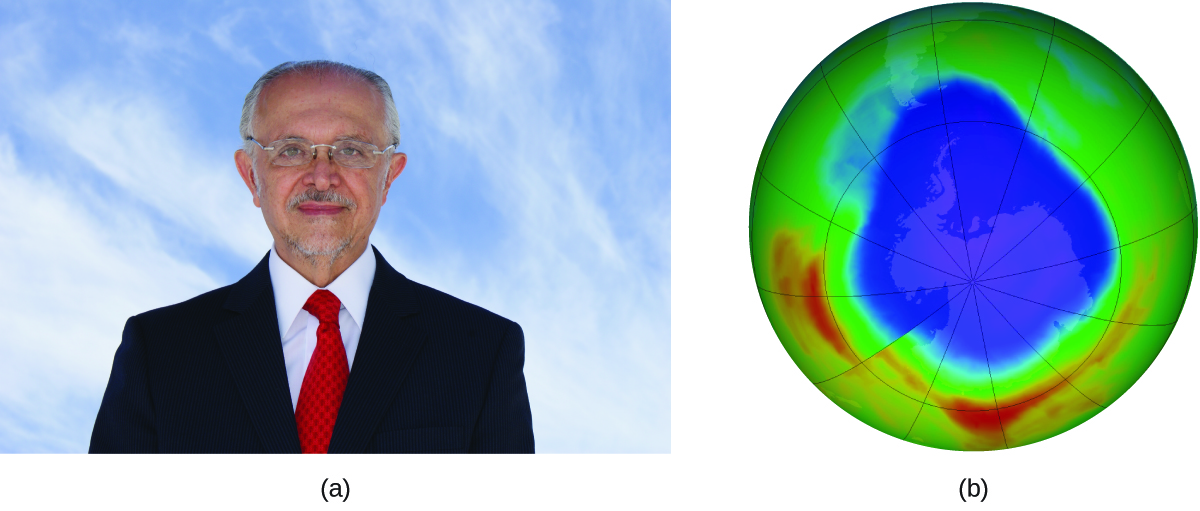
In 1974, Molina and Rowland published a paper in the journal Nature (one of the major peer-reviewed publications in the field of science) detailing the threat of chlorofluorocarbon gases to the stability of the ozone layer in earth’s upper atmosphere. The ozone layer protects earth from solar radiation by absorbing ultraviolet light. As chemical reactions deplete the amount of ozone in the upper atmosphere, a measurable “hole” forms above Antarctica, and an increase in the amount of solar ultraviolet radiation— strongly linked to the prevalence of skin cancers—reaches earth’s surface. The work of Molina and Rowland was instrumental in the adoption of the Montreal Protocol, an international treaty signed in 1987 that successfully began phasing out production of chemicals linked to ozone destruction.
Molina and Rowland demonstrated that chlorine atoms from human-made chemicals can catalyze ozone destruction in a process similar to that by which NO accelerates the depletion of ozone. Chlorine atoms are generated when chlorocarbons or chlorofluorocarbons—once widely used as refrigerants and propellants—are photochemically decomposed by ultraviolet light or react with hydroxyl radicals. A sample mechanism is shown here using methyl chloride:
Chlorine radicals break down ozone and are regenerated by the following catalytic cycle:
A single monatomic chlorine can break down thousands of ozone molecules. Luckily, the majority of atmospheric chlorine exists as the catalytically inactive forms Cl2 and ClONO2.
Since receiving his portion of the Nobel Prize, Molina has continued his work in atmospheric chemistry at MIT.
Glucose-6-Phosphate Dehydrogenase Deficiency
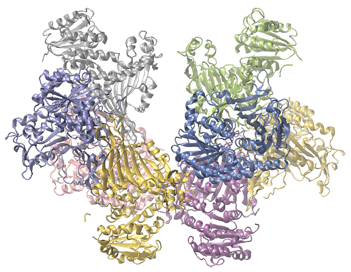
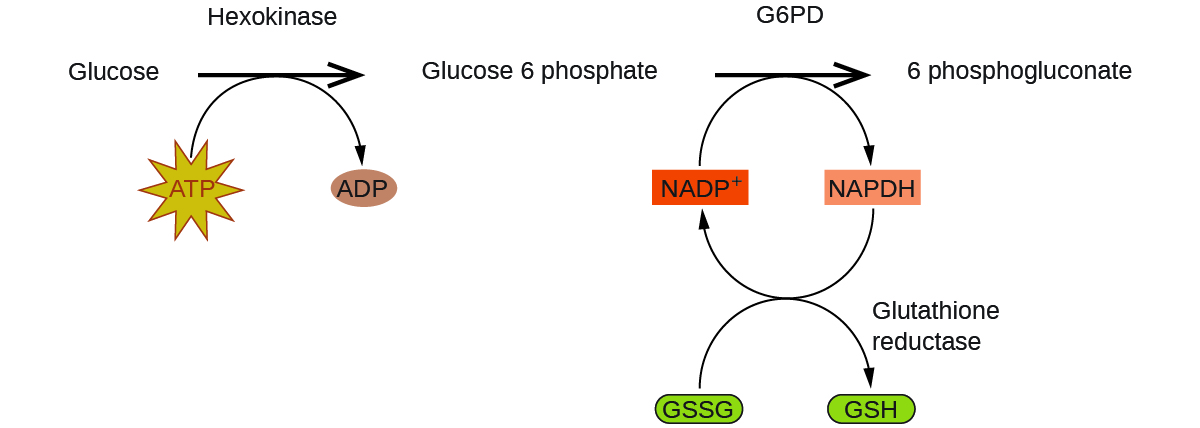
Enzymes in the human body act as catalysts for important chemical reactions in cellular metabolism. As such, a deficiency of a particular enzyme can translate to a life-threatening disease. G6PD (glucose-6-phosphate dehydrogenase) deficiency, a genetic condition that results in a shortage of the enzyme glucose-6-phosphate dehydrogenase, is the most common enzyme deficiency in humans. This enzyme, shown in Figure 4, is the rate-limiting enzyme for the metabolic pathway that supplies NADPH to cells (Figure 5).
A disruption in this pathway can lead to reduced glutathione in red blood cells; once all glutathione is consumed, enzymes and other proteins such as hemoglobin are susceptible to damage. For example, hemoglobin can be metabolized to bilirubin, which leads to jaundice, a condition that can become severe. People who suffer from G6PD deficiency must avoid certain foods and medicines containing chemicals that can trigger damage their glutathione-deficient red blood cells.
Heterogeneous Catalysts
A heterogeneous catalyst is a catalyst that is present in a different phase (usually a solid) than the reactants. Such catalysts generally function by furnishing an active surface upon which a reaction can occur. Gas and liquid phase reactions catalyzed by heterogeneous catalysts occur on the surface of the catalyst rather than within the gas or liquid phase.
Heterogeneous catalysis has at least four steps:
- Adsorption of the reactant onto the surface of the catalyst
- Activation of the adsorbed reactant
- Reaction of the adsorbed reactant
- Diffusion of the product from the surface into the gas or liquid phase (desorption).
Any one of these steps may be slow and thus may serve as the rate determining step. In general, however, in the presence of the catalyst, the overall rate of the reaction is faster than it would be if the reactants were in the gas or liquid phase.
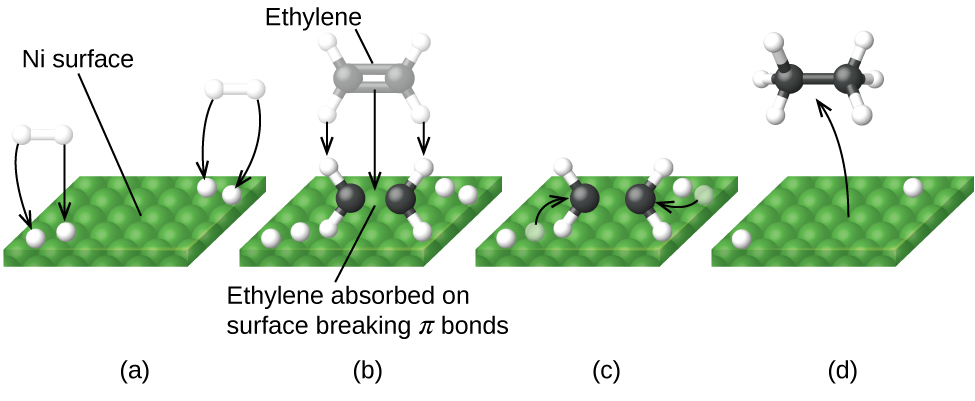
Figure 6 illustrates the steps that chemists believe to occur in the reaction of compounds containing a carbon–carbon double bond with hydrogen on a nickel catalyst. Nickel is the catalyst used in the hydrogenation of polyunsaturated fats and oils (which contain several carbon–carbon double bonds) to produce saturated fats and oils (which contain only carbon–carbon single bonds).
Other significant industrial processes that involve the use of heterogeneous catalysts include the preparation of sulfuric acid, the preparation of ammonia, the oxidation of ammonia to nitric acid, and the synthesis of methanol, CH3OH. Heterogeneous catalysts are also used in the catalytic converters found on most gasoline-powered automobiles (Figure 7).
Automobile Catalytic Converters
Scientists developed catalytic converters to reduce the amount of toxic emissions produced by burning gasoline in internal combustion engines. Catalytic converters take advantage of all five factors that affect the speed of chemical reactions to ensure that exhaust emissions are as safe as possible.
By utilizing a carefully selected blend of catalytically active metals, it is possible to effect complete combustion of all carbon-containing compounds to carbon dioxide while also reducing the output of nitrogen oxides. This is particularly impressive when we consider that one step involves adding more oxygen to the molecule and the other involves removing the oxygen (Figure 7).
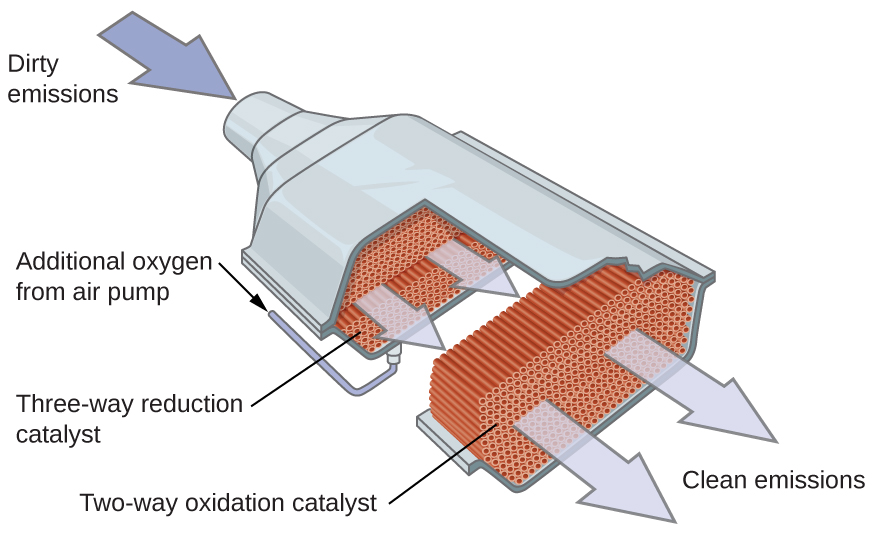
Most modern, three-way catalytic converters possess a surface impregnated with a platinum-rhodium catalyst, which catalyzes the conversion nitric oxide into dinitrogen and oxygen as well as the conversion of carbon monoxide and hydrocarbons such as octane into carbon dioxide and water vapor:
In order to be as efficient as possible, most catalytic converters are preheated by an electric heater. This ensures that the metals in the catalyst are fully active even before the automobile exhaust is hot enough to maintain appropriate reaction temperatures.

The University of California at Davis’ “ChemWiki” provides a thorough explanation of how catalytic converters work.
Enzyme Structure and Function
The study of enzymes is an important interconnection between biology and chemistry. Enzymes are usually proteins (polypeptides) that help to control the rate of chemical reactions between biologically important compounds, particularly those that are involved in cellular metabolism. Different classes of enzymes perform a variety of functions, as shown in Table 36.
| Class | Function |
|---|---|
| oxidoreductases | redox reactions |
| transferases | transfer of functional groups |
| hydrolases | hydrolysis reactions |
| lyases | group elimination to form double bonds |
| isomerases | isomerization |
| ligases | bond formation with ATP hydrolysis |
| Table 36. Classes of Enzymes and Their Functions | |
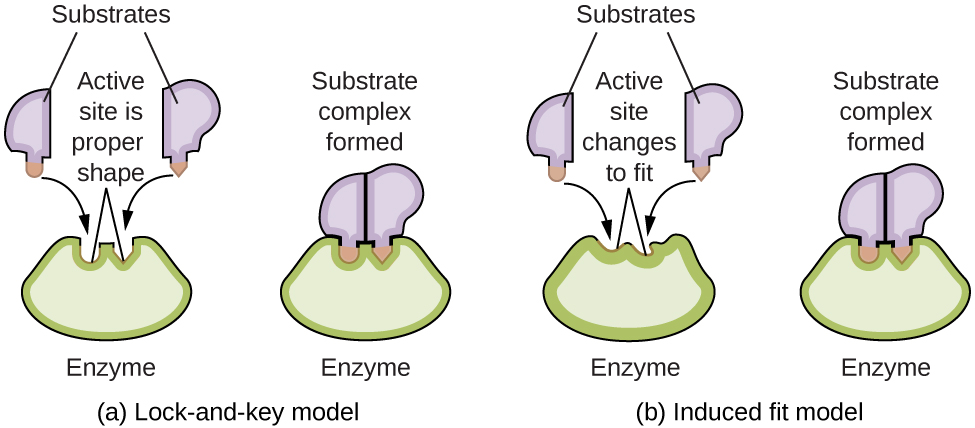
Enzyme molecules possess an active site, a part of the molecule with a shape that allows it to bond to a specific substrate (a reactant molecule), forming an enzyme-substrate complex as a reaction intermediate. There are two models that attempt to explain how this active site works. The most simplistic model is referred to as the lock-and-key hypothesis, which suggests that the molecular shapes of the active site and substrate are complementary, fitting together like a key in a lock. The induced fit hypothesis, on the other hand, suggests that the enzyme molecule is flexible and changes shape to accommodate a bond with the substrate. This is not to suggest that an enzyme’s active site is completely malleable, however. Both the lock-and-key model and the induced fit model account for the fact that enzymes can only bind with specific substrates, since in general a particular enzyme only catalyzes a particular reaction (Figure 8).
The Royal Society of Chemistry provides an excellent introduction to enzymes for students and teachers.
SCIENTIST PROFILE
Dr. Frances H. Arnold

Dr. Frances Arnold was awarded a portion of the Nobel Prize in Chemistry 2018. She became the fifth woman to win the Nobel Prize in Chemistry.
The work for which Dr. Arnold was awarded is centered around directed evolution. Her research focused on making changes in the DNA for certain enzymes and then selecting which changes provided the desired effect in the enzyme.
These enzymes can be developed for use in a variety of applications, including biofuel production and custom medicines.
In addition to her Nobel Prize winning work, Dr. Arnold holds over 40 patents and is currently the Linus Pauling Professor of Chemical Engineering, Bioengineering, and Biochemistry at Caltech.
Key Concepts and Summary
Catalysts affect the rate of a chemical reaction by altering its mechanism to provide a lower activation energy. Catalysts can be homogenous (in the same phase as the reactants) or heterogeneous (a different phase than the reactants).
Chemistry End of Chapter Exercises
- Account for the increase in reaction rate brought about by a catalyst.
- Compare the functions of homogeneous and heterogeneous catalysts.
- Consider this scenario and answer the following questions: Chlorine atoms resulting from decomposition of chlorofluoromethanes, such as CCl2F2, catalyze the decomposition of ozone in the atmosphere. One simplified mechanism for the decomposition is:
[latex]\text{O}_3\;{\xrightarrow{\text{sunlight}}}\;\text{O}_2\;+\;\text{O} \\[0.5em] \text{O}_3\;+\;\text{Cl}\;{\longrightarrow}\;\text{O}_2\;+\;\text{ClO} \\[0.5em] \text{ClO}\;+\;\text{O}\;{\longrightarrow}\;\text{Cl}\;+\;\text{O}_2[/latex](a) Explain why chlorine atoms are catalysts in the gas-phase transformation:
[latex]2\text{O}_3\;{\longrightarrow}\;3\text{O}_2[/latex]
(b) Nitric oxide is also involved in the decomposition of ozone by the mechanism:
[latex]\text{O}_3\;{\xrightarrow{\text{sunlight}}}\;\text{O}_2\;+\;\text{O} \\[0.5em] \text{O}_3\;+\;\text{NO}\;{\longrightarrow}\;\text{NO}_2\;+\;\text{O}_2 \\[0.5em] \text{NO}_2\;+\;\text{O}\;{\longrightarrow}\;\text{NO}\;+\;\text{O}_2[/latex]
Is NO a catalyst for the decomposition? Explain your answer.
- For each of the following pairs of reaction diagrams, identify which of the pair is catalyzed:
(a)
(b)
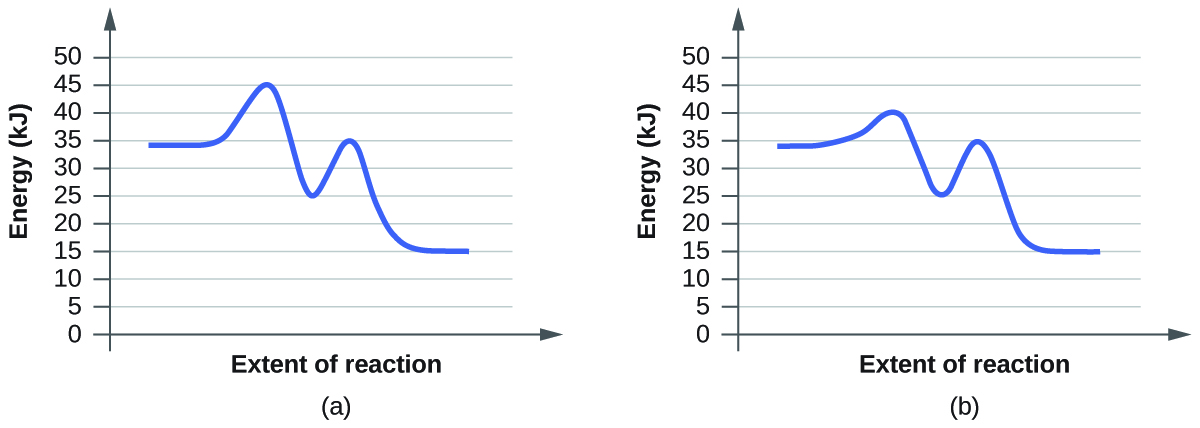
- For each of the following pairs of reaction diagrams, identify which of the pairs is catalyzed:
(a)
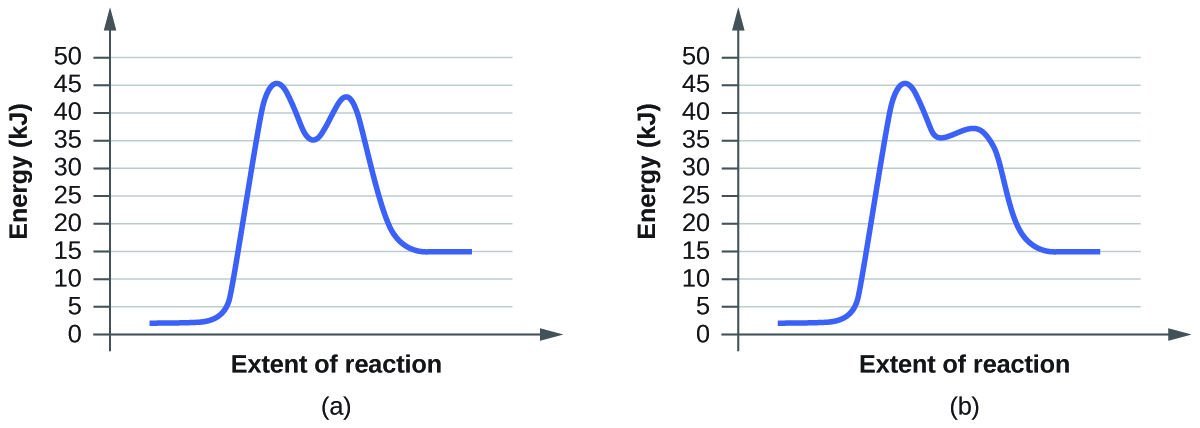
(b)
- For each of the following reaction diagrams, estimate the activation energy (Ea) of the reaction:
(a)
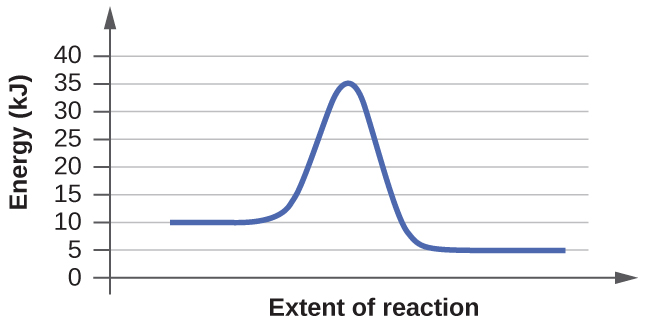
(b)
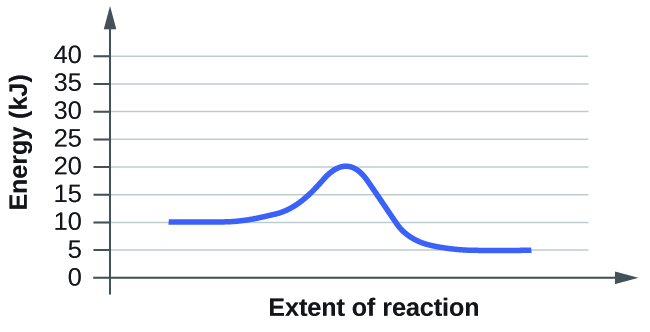
- For each of the following reaction diagrams, estimate the activation energy (Ea) of the reaction:
(a)
(b)
- Based on the diagrams in Chemistry End of Chapter Exercise 6, which of the reactions has the fastest rate? Which has the slowest rate?
- Based on the diagrams in Chemistry End of Chapter Exercise 7, which of the reactions has the fastest rate? Which has the slowest rate?
Glossary
- heterogeneous catalyst
- catalyst present in a different phase from the reactants, furnishing a surface at which a reaction can occur
- homogeneous catalyst
- catalyst present in the same phase as the reactants
Solutions
Answers to Chemistry End of Chapter Exercises
1. The general mode of action for a catalyst is to provide a mechanism by which the reactants can unite more readily by taking a path with a lower reaction energy. The rates of both the forward and the reverse reactions are increased, leading to a faster achievement of equilibrium.
3. (a) Chlorine atoms are a catalyst because they react in the second step but are regenerated in the third step. Thus, they are not used up, which is a characteristic of catalysts. (b) NO is a catalyst for the same reason as in part (a).
5. The lowering of the transition state energy indicates the effect of a catalyst. (a) A; (b) B
7. The energy needed to go from the initial state to the transition state is (a) 10 kJ; (b) 10 kJ
9. Both have the same activation energy, so they also have the same rate.
- “The Nobel Prize in Chemistry 1995,” Nobel Prize.org, accessed February 18, 2015, http://www.nobelprize.org/nobel_prizes/chemistry/laureates/1995/. ↵
