(2021) Second Place: Final Lab Report: Dihydrofolate Reductase (DHFR)
By Joanna Beck
Dihydrofolate reductase (DHFR) is an enzyme involved in the synthesis of purines and thymidylate. It functions by converting dihydrofolate into tetrahydrofolate (Lin & Gerson, 2014). Increased expression of DHFR can be linked to tumor resistance to methotrexate, a drug used in chemotherapy treatment (Nakano, Fukami, Gotoh, & Nakajima, 2017).
Gaining an understanding of DHFR can lead to discoveries that would further improve the treatment of cancer in a clinical setting. The production of large amounts of purified protein can make it easier to measure protein activity and interpret an SDS-PAGE gel.
In our experiment, we are expressing and purifying recombinant DHFR following methods from BioRad: Protein Expression and Purification (Bio-Rad Laboratories, Inc., n.d.). Similar experiments have been conducted in previous semesters and our goal is to further test variables to find more efficient methods of producing purified protein. Different lab groups are testing various methods of cell storage: cells left in suspension vs. pelleted down. Another variable that is being tested is the method of freezing the cells during the cell lysis process; some groups held the microcentrifuge tube in the dry ice/ethanol bath, while others let it float on the surface, and others froze the cells at -80° C.
Our group (#4) is testing the method of pelleting the cells and allowing the microcentrifuge tube to float during the freezing cycles. I expect there to be no significant difference between our yield and the yield of those who submerged their tube during the lysis procedure since the lysed cell fractions appeared to be completely frozen. Our lab group pelleted the cells after induction and before refrigeration. I expect to have a higher yield than the non-pelleted group which followed the same lysis protocol since cells are often pelleted for storage for better preservation.
Materials and Methods:
Complete material list can be found in the Protein Expression and Purification Series protocol by Bio-Rad Laboratories (Bio-Rad Laboratories, Inc., n.d.). Protocols were followed as written in the above-mentioned document and aseptic technique was used in accordance with the Microbiology: Laboratory Theory & Application protocol (Aseptic Technique Protocol). Lab activities are outlined below with details describing changes from the original protocols (Bio-Rad Laboratories, Inc., n.d.).
- Plate Cells: Isolation streak plating of BL21 (DE3) E. coli on LB/amp plate. Modified protocol was followed (Isolation Streak Plating Practice Protocol) with 7.5ul per plate. Two plates were inoculated to ensure useable cell colonies.
- Inoculate: Several cell colonies appeared favorable. Chosen cell colonies were inoculated in LB/amp broth in order to allow cells to multiply in favorable conditions (37° C, glucose for food).
- Subculture, Monitor and Induce Cell density was measured using UV-Vis spectrophotometer and found to be sufficient. OD600 of 1:10 dilution of overnight culture: 0.934. Subculture was induced according to protocol (Bio-Rad Laboratories, Inc., n.d.).
- Harvest and Lyse: Cells were pelleted on the same day as above procedure (four hours had elapsed before continuing). Lysing took place according to protocol (Bio-Rad Laboratories, Inc., n.d.). When cells were chilled in the ethanol and dry ice bath, they were not manipulated to ensure even cooling, however cells appeared to be completely frozen and completely thawed upon each cycle.
- Purification: Soluble and insoluble materials were separated following protocol (Bio-Rad Laboratories, Inc., n.d.). Hypodermic needle was used to break up cell chunks. Vortex was used for further agitation. No visible insoluble fraction was with the soluble fraction at the end of separation.
- Affinity and Size Exclusion (Desalting) Purification: Protocol was followed as written using aseptic techniques (Bio-Rad Laboratories, Inc., n.d. pg. 101-103) including preparing SDS-PAGE samples. Desalting the eluate took place on a different date (11/30/20).
- Protein Quantification: Protein quantification protocol (Bio-Rad Laboratories, Inc., n.d. pg. 104-105) was followed as written and resulted in the following values: 1.356 mg/mL of protein for the eluate and 0.345 mg/mL for the desalting eluate. The protocol notes that it is ideal to have greater than 0.1 mg/mL of protein in the desalted elution fraction (Bio-Rad Laboratories, Inc., n.d. pg. 104-105).
- SDS-PAGE Electrophoresis: SDS-PAGE electrophoresis protocol was followed as written (Bio-Rad Laboratories, Inc. (n.d. pg. 106-107). It was completed twice, on two different days since the desalted eluate was not ready for the first day. See figures below. The first gel tore but results are still visible.
- Gel Imaging using Azure c600: Procedure was followed as written in document modified from the Azure Biosystems user manual (Azure c150, c200, C300, C400, C500, C600).
Results:
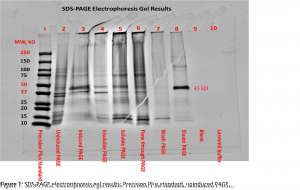
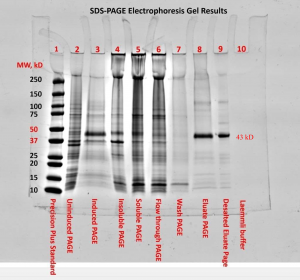

The SDS-PAGE electrophoresis protocol was followed. We can see in figures one and two the presence of a faint band for the uninduced PAGE (lane 2) and more noticeable band for the induced PAGE (lane 3) near the 43kDa mark. This band also appears in lanes 3-7 and was highly visible for the eluate PAGE (lane 8) and desalted eluate PAGE (lane 9 in figure 2). There appeared to be a band around the 15kDa mark for lanes 2-8, with higher visibility for the soluble PAGE (lane 5) and flow through PAGE (lane 6). These strong bands at approximately the 12kDa mark in lanes 5 and 6 can be attributed to lysozyme and should be expected (Bio-Rad Laboratories, Inc., n.d.). Both the blank (lane 9) and Laemmli buffer (lane 10) show no apparent bands. The first lane, containing Precision Plus standard, provided a reference ladder for interpreting the gel.
Discussion:
Since increased expression of DHFR can be linked to tumor resistance during chemotherapy treatment (Nakano, Fukami, Gotoh, & Nakajima, 2017), gaining an understanding of DHFR can lead to discoveries that would further improve the treatment of cancer in a clinical setting. Producing large amounts of purified DHFR protein can allow for more reliable data through larger sample sizes.
The presence of a faint band for the uninduced PAGE (lane 2) and more noticeable band for the induced PAGE (lane 3) near the 43kDa mark are an indication of successful induction of GST-DHFR-His. Progressing to the soluble PAGE (lane 5) the band became fainter. This could possibly be attributed to some of the protein misfolding and aggregating.
The experimental variables we followed (group four) included following the lab procedures with a freeze thaw method of allowing the microcentrifuge tubes to float freely in the dry ice/ethanol bath for five minutes. Cells were pelleted that day and stored for one week (as opposed to being stored with cells in suspension). Cells were stored in the refrigerator at approximately 4° C.
During the freeze/thaw cycle the microcentrifuge tubes appeared to be completely frozen. It is thought that there is likely no significant difference between results from the various freeze/thaw cycles and methods of cell storage (pelleting vs. leaving in suspension). Another student with the same variables had similar results with more faint, but visible bands at the ~43kDa mark in both the eluate and desalted eluate. The group that left their cells in suspension and changed the freeze/thaw protocol to freezing at -80° C saw visible bands at the ~43kDa mark for both the eluate and desalted eluate in one sample and no band for the desalted eluate on the other. The group that pelleted their cells before refrigeration and changed the freeze/thaw protocol to freezing at -80° C saw strong bands at the ~43kDa mark for both the eluate and desalted eluate. The group that pelleted their cells before refrigeration and held down their tube during the freeze/thaw cycles saw strong bands at the ~43kDa mark for both the eluate and desalted eluate. It is, however, possible that a shorter induction time could produce better results (cells were induced for four hours). Further experimentation is needed to determine if an altered induction time would result in a more favorable yield of the GST-DHFR-His protein.
References
Aseptic Technique Protocol, Microbiology: Laboratory Theory & Application, by Michael J. Leboffe and Burton E. Pierce, 3e, Morton Publishing
Azure c150, c200, C300, C400, C500, C600 user manual PDF download. (n.d.). ManualsLib – Makes it easy to find manuals online. (Modified) https://www.manualslib.com/manual/1253318/Azure-C150-C200-C300-C400-C500-C600.html
Bio-Rad Laboratories, Inc. (n.d.). Protein Expression and Purification Series. Retrieved from https://www.bio-rad.com/webroot/web/pdf/lse/literature/pepsi_hr_1665067.pdf Page 195, 213, and more
Isolation Streak Plating Practice Protocol, Modified from Biorad Biotechnology ExplorerTM, Protein Expression and Purification Series, pepsi_hr_1665067.pdf, pages 91 – 92
Lin, Y., & Gerson, S. L. (2014). Clinical trials using LV-P140K-MGMT for gliomas. Gene Therapy of Cancer, 379-391. doi:10.1016/b978-0-12-394295-1.00026-3
Nakano, M., Fukami, T., Gotoh, S., & Nakajima, M. (2017). A-to-I RNA editing up-regulates human Dihydrofolate reductase in breast cancer. Journal of Biological Chemistry, 292(12), 4873-4884. doi:10.1074/jbc.m117.775684
