2 Exp. 2: Light and Nanotechnology; How do we ‘See’ Something too Small to See?
Pre-Lab; may be included on BB pre-quiz:
Read the lab experiment and answer the following questions prior to coming to lab. Note that the last question will require a spreadsheet file.
- Define spectrophotometry, absorbance, cuvette, and wavelength.
- Find the molarity of a 1.00 L sample that contains 47.6 g NaCl.
- Find the wavelength (in nanometers) of light with a frequency of 4.47 x 10¹⁴ s-1.
- What is the amount of energy in one photon of light emitted by the red laser (assume 670 nm)?
- Graph the following data using excel®. Enter concentration units into the A column, as the independent variable. Excel will assign these values to the x axis of a scatter plot. Enter absorbance into the B column. Excel will assign these values to the y axis of a scatter plot. In excel, choose insert, scatter plot (no line) Add the equation of the line (right click on a data point). Use the linear equation to solve for the concentration (x) of a sample whose absorbance (y) is 0.231. See your lab appendix for excel help.
| Absorbance (nm) | Concentration (M) |
| 0.050 | 0.100 |
| 0.104 | 0.200 |
| 0.198 | 0.400 |
| 0.301 |
- Explain the safety concerns in this lab and how to avoid getting injured.
- In using the Vernier spectrophotometer,
- Why must you always use the same cuvette for your sample?
- Why was it important to wipe your fingerprints off the cuvette or shake bubbles out of the cuvette before measuring with it?
Pre-Introduction
A mole of particles is defined as 6.022 x 10²³. Molarity (M) is a concentration unit defined as the number of moles solute per liter solution and describes the concentration of a solution. For example, a 1.0 M aqueous solution of NaCl contains one mole of NaCl, or 6.022 x 10²³ formula units of NaCl for each liter of the solution. Molarity will be one measure of concentration used later in your lecture course. If a 1.00 L solution contained 65 g NaCl, the mass NaCl would first be converted to moles 65g/58.44g/mol = 1.11mol NaCl. The moles NaCl would then be divided by the liter’s solution (1.00) to yield a 1.11 M solution.
Introduction
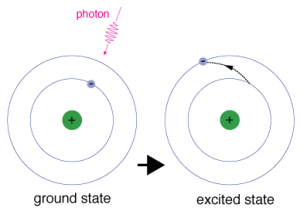
“Excited State Electron” by NASA is in the Public Domain
Nanotechnology is both a very old and new discipline of study. The antimicrobial properties of colloidal (nano) silver were known to both the ancient Greeks and Babylonians. Nano-sized conglomerations of metals have long been used in creating stained glass. Red, for example, is tinted by gold aggregating at the nanoscale and yellow created with silver particles. More recently carbon nanotubes, valued for both strength and lightness, have been introduced to bicycle frames and tennis rackets, among other applications. NASA has used silver nanotechnology in water purification to be used in space. Modern sunscreens use nano-sized molecules to absorb certain wavelengths of ‘light.’ Biomedical applications of nanoscience are some of the most rapidly progressing fields of nanoscience.
Nano science refers to the application of materials with a dimension of 100 nm or less, with nano referring to a billionth of a meter, much too small to evaluate with standard measurement techniques. In this lab, you will indirectly measure the size of nano sized silver aggregations as well as the width of human hair using interaction with light. Although the width of hair is larger than nanoscale, it is too small to use standard measurement techniques. Some background and theory will facilitate your lab work.
Spectrophotometry is essentially the measurement (“metry”) of light particles (“photo”) coming from the electromagnetic spectrum (“spectro”). We are dealing with moving electrons around in the outer parts of an atom or a molecule. When these electrons move from one radius or distance from the nucleus to another there is a certain quantity of energy involved (Figure 1). This particular quantity of energy is what we are measuring.
You are going to be looking at how much energy is involved in moving an electron from one place to another in a real atom. There are several relationships we need to look at next:
E = h ν Equation 1
E = energy h = Planck’s constant ν = frequency
Where h = 6.626 x 10⁻³⁴ J·s
(The frequency is how many waves of light pass a given point in one second).
c = λν or ν= Equation2
Where c is the speed of light and l is the length of one wave of the light, or wavelength. If we combine these two, we get . . .
E= Equation 3
Where c = 2.998 x 10⁸ m s-1
What is of most importance is that energy is directly related to the wavelength of light. If we monitor the wavelength of light, we can know something about the energy involved, and even learn about the path that an electron takes. Specific amounts of energy have specific wavelengths associated with them.
The narrow region of ‘light’ in the electromagnetic spectrum that we can see, ~400 to 800nm, is called the visible spectrum. Some birds, crustaceans, and insects, however, can see beyond our visible spectrum to a second violet.
A continuous visible spectrum is detected as white light, and an absence of energy in the wavelengths of the visible spectrum is detected as black, or absence of light. Light, as a wave, can be influenced, or reflected, refracted, or absorbed. If a particle or molecule absorbs white light at 620 nm, or orange, the eye will see the remaining reflected wavelengths as white minus orange, or orange’s complimentary color, blue. From this absorption, the size of particles can be inferred.
Silver Nanoparticles:
The color visible in solutions of silver nanoparticles depends on the size and shape of the particles present. In this lab you will perform a precise and sequential series of reactions which will reduce Ag+ ions to Ag(s). Sodium borohydride (NaBH4(aq)) is used as the reducing agent according to the following reaction.
8AgNO3(aq) + NaBH4(aq) + 4H2O(l) à 8Ag(s) + Na[B(OH)4]aq + 8HNO3(aq) Reaction 1
The silver atoms then begin to aggregate, which will continue until the particles are coated with a charges species that inhibits further aggregation. Hydrogen peroxide oxidizes, or removes electrons from the atom, quenching the aggregation as follows.
2Ag(s) + H2O2(aq) + 2H+(aq) à 2Ag+(aq) + 2H2O(l) Reaction 2
The borohydride and peroxide cooperate to form the appropriate size nanoparticle to produce visible color and a signature absorption. Bromide is added to control the size of particles. As more bromide is added, the size of the nano prisms decreases (Table 1).
The absorption of white light can then be seen visually as color as the size of nanoparticle dictates interaction with specific wavelength of white light. The absorption at a certain wavelength can also be quantified via a spectrometer. As discussed earlier, if a sample absorbs in the yellow (580 nm) region, an observer will see a violet solution, or complimentary color. By measuring the wavelength of peak absorbance, nanoparticle size can be inferred, as the size of the aggregation dictates the wavelength of light influenced. Absorption will not be needed in this lab, but is dependent on both concentrations, and the path length of the light. In this lab, you will build a calibration between sodium bromide concentration and peak wavelength (λ) absorption, which will then be used to approximate the concentration of sodium bromide.
| Table 1: Effect of Bromide on Silver Nano prism Size | |||
| Volume KBr added (µL) | Molarity KBr in soln. | Expected Color | Average Width Silver Nano prism (nm) |
| 25 | 2.63 x 10⁻⁹ | Blue | ~64 |
| 35 | 3.68 x 10⁻⁹ | Orange-red | ~35 |
| 45 | 4.74 x 10⁻⁹ | Yellow | ~20 |
Separating Light: Perhaps you are familiar with a prism, which separates light via refraction. A second method of separating light is the single slit diffraction, which will be approximated using light bending around a human hair. In a single slit diffraction, light passes through a narrow slit of width w and strikes a screen at a distance L from the slit.
When light of the same wavelength, such as one color of laser light, passes through a small single slit, light bends around the corners of the slit and spreads. When bent light arrives at the screen in phase, a constructive or bright line emerges and when it arrives out of phase a destructive or dark space becomes visible on the screen (figure 4). The diffraction pattern, z, or distance between the center and dark lines, can be used in calculating w or in our experiment, width of hair, or any other small opaque body based on Babinet‘s principle. Diffraction patterns from apertures of known size and shape, for instance, are compared with the pattern of an unknown solid object. The size of red blood cells can be found with such a technique. In order to use the principle, the relationship between λ, L, z and w must be established.
= zn/L Equation 4
= nλ Equation 5
n = 1, 2, 3, zn, and is the number of destructive diffractions, or dark spots from the center. If you measure z from the center to the first dark spot, n = 1, to the second spot, n = 2, etc. L is the distance between the laser source and the screen. Be careful to use the same units for both zn and L as the distance units must cancel in equation #4. Using the distances z and L, can be solved for and can be used in equation #5. The diffraction angles, are too small to be measured mechanically with a protractor. Lambda (λ) must be inferred based on the color of laser. Some of the laser pointers are labeled with a wavelength range. You may pick the mid-point of that range, look at a neighbor’s laser label, or infer wavelength from the color of laser (figure 2). You can now solve for w, or width of hair. Please note: the distance unit of hair width corresponds to the unit that you used for wavelength (λ) in equation #5.
Objectives
The objective of this lab is to use light interaction to perform distance measurements that are too small to use standard measurement techniques. The width of hair and the peak absorbance of silver aggregate will be measured using diffraction and absorption. The particle size of the silver aggregate will be estimated. A calibration curve will be used in order to find the bromide concentration of an unknown silver nanoparticle solution.
Safety/Housekeeping
- Do not point the laser toward anyone’s eyes
- Sodium Citrate and Peroxides are strong oxidizers, use caution and wear goggles
- Discard all silver nanoparticle waste, including from cuvettes to the waste container in hood #1
- Discard your syringes to the marked waste container in hood #1 rather than the normal trash
- Rinse special glassware including beakers vials and cuvettes with DI water and return to the tray that you got it from
Procedure: Silver Nano-Prism:
Materials:
Solutions; Prepared Weekly:
- A) 0375 M sodium citrate
- B) 000375 M silver nitrate
- C) 050 M hydrogen peroxide
- D) 0010 M potassium bromide (instructor only)
- E) 0050 M sodium borohydride (prepared daily)
- F) Unknown sample for analysis
Glassware and apparatus:
- A) Plastic syringes – 4 per group
- B) Acid washed beakers supplied by stockroom, do not use the beakers from your drawers, they are not clean enough. – 4 per group
- C) Acid washed 20 mL screw cap vials – 3 per group
- D) Cuvette: 1 per group
- E) Disposable pipettes – 5 per group
Procedure
The solutions you will be using are provided in stock bottles and labeled with the chemical name and a letter designation A, B, C, and E. Label each of four beakers A, B, C, and E. Each group should pour approximately 20 ml of each solution into the corresponding labeled beaker. DO NOT WORK OUT OF THE STOCK SOLUTION BOTTLES, FILL EACH RESPECTIVE BEAKER AND TAKE BACK TO YOUR WORK BENCH. There should be plenty of solution for each of 8 groups.
|
|
|
|
|
Solution D – Will be in a mall glass vial and it will be added by your instructor or stockroom personnel. Your instructor may want you to add solution D. If so, follow his or her instructions
Label three screw cap vials 1, 2, and 3.
25 µl KBr 35 µl KBr 45µl KBr
You will be adding the respective solutions from the beakers to the screw cap vials with the syringes. DO NOT MIX UP ANY OF THE SYRINGES. This experiment will not work correctly if you have cross contamination of any of the chemicals. Do not use the same syringe for different solutions.
The order of addition of the chemical reagents is critical. Do not deviate from the steps outlined below. Using the syringes provided, add each reagent drop wise and do not touch the syringes to the sides of the vials. Do not mix or shake the vials until all the reagents are added. Then replace the caps gently swirl the vial.
Step 1 – Using a clean syringe, add 2 ml of solution (A) Sodium Citrate 0.0375 M to each vial 1, 2, and 3.
Step 2– Using a clean syringe; add drop wise, 5 ml of solution (B) Silver Nitrate 0.000375 M to each vial, 1, 2, & 3.
Step 3 – Using a clean syringe, add drop wise, 5 ml of solution (C) Hydrogen Peroxide 0.05 M to each vial 1, 2, and 3.
Step 4. Your instructor will supervise the addition of solution D using the micro pipette. A new pipette tip will be used for each addition. Discard the pipette tips in the container provided.
Vial 1 – Using a clean pipette tip carefully add 25 µl of solution D, 0.001M Potassium Bromide, (KBr) to vial 1 and replace cap on vial.
Vial 2 – Using a second clean pipette tip carefully add 35 µl of solution D, 0.001M Potassium Bromide, (KBr) to vial 2 and replace cap on vial.
Vail 3 – Using a third clean pipette tip carefully add 45 µl of solution D, 0.001M Potassium Bromide, (KBr) to vial 3 and replace cap on vial.
Step 5 – With a clean syringe, slowly add drop wise, 2.5 ml of solution (E) Sodium Borohydride 0.005 M to vial 1. This step will initiate the reduction reaction and other reactions forming the silver nanoparticles.
Step 6 – Replace the cap on the vial and gently swirl the vial to mix. A yellow color will begin to appear, and it will change over time. It should take about 3 – 5 minutes for the color to develop.
Step 7 – Repeat steps 5 and 6 for vials 2 and 3.
After development, the color of each of the respective solutions, with darker or lighter variations, should develop as follows:
25 µl KBr 35 µl KBr 45µl KBr
Step 8. You will be determining the wavelength of maximum absorbance, λmax, of each sample by use of the Vernier Spectrometer and the Logger Pro Software installed on the laboratory computers. Your instructor will provide you with instructions on using the Vernier Spectrometer. The light path should travel through the clear or un-ribbed path of the cuvette. The cuvette must hold enough solution for the light to travel through. Be careful to avoid bubbles or fingerprints on the cuvette as this will change the light absorption. You will begin with deionized water in your cuvette for calibration. In subsequent measurements, rinse your cuvette with the solution to be measured. This rinse is closer to your desired solution than D.I. water, which may dilute your desired measurement.
Step 9. You will find the wavelength of maximum absorbance, λmax, of an unknown made by following the laboratory procedures, and doped with an unknown volume of KBr. The volume of KBr added is of the same order of magnitude as the volumes that you have used. Record the peak absorption for reference with a calibration curve which you will create.
The following example data table may be useful. The reaction is sensitive to environmental factors, and the volume KBr may need to be adjusted by your instructor.
| Data Table 3: Volume KBr (µL) Against Wavelength of max Absorption, λmax, (nm) | ||||
| Volume KBr (µL) | 25 µL | 35 µL | 45 µL | Unknown |
| λmax (nm) |
Step 10. You will create a calibration curve in order to find the volume KBr in your unknown data using your known dat. Using a spreadsheet formula such as excel, plot the volume KBr in µL (x-axis) against the peak absorption wavelength, λ, in nm (y-axis). In excel, the A column defaults to the x-axis and the B column to the y. Your calibration curve will have three points. With your data selected, insert an XY (Scatter) plot (no line).
Right click on a point on the graph and select [Add Trendline]. This will give you the option of selecting [Display Equation] of the line. See the student appendix for more information on graphing with excel. You can also display the R2 value, which informs the linearity of your data. A perfect line has an R2 value of 1. You now have a linear equation in slope intercept form. Recall that the y value is the wavelength of peak absorption (ƛ) of your unknown compound. Use the linear equation and your known y value to find the x value, or volume KBr added. Points will be awarded for approximating the correct unknown value, or volume of KBr in µL. You should include your regression in your informal report, including a graph title and axis titles. The linear equation should be visible as well. You can use the snip app to capture your regression and should not include the entire spreadsheet.
Procedure: Width of Hair
Materials: Laser pointer (red), hair (red or other), paper, ruler, clear tape, measuring tape.
- Obtain a single strand of hair. You may be able to measure the differences in fine and full-bodied hair. You will use two samples, so it may be interesting to choose two different types of hair and predict the results.
- Tape the hair across the laser pointer. Only the hair should cross the path of the laser.
- Point the laser pointer at the wall or paper. You will notice that as you move further from the wall, the diffraction pattern becomes larger, minimizing your measurement error. It also, however, becomes fainter. Find a distance that takes both of these factors into account.
- Measure the distance, L, from the front of the laser pointer to the screen. Be sure to note the distance unit. You may tape the laser pointer to a counter or book if helpful.
- Measure the distances, z1 and z2 from the center of the light to the center of the first and second dark (destructive) bands. If you have a clear diffraction pattern, the third diffraction band can work as well, minimizing measurement error, and yielding easily measured distance.
The following example data table may be helpful in collecting your measurements.
| Data Table 1: Diffraction from Hair Measurement | |
| Hair Sample 1 | Hair Sample 2 |
| L with unit | L with unit |
| z1 with unit | z1 with unit |
| z2 with unit | z2 with unit |
| Hair Type: fine, medium, coarse | Hair Type: fine, medium, coarse |
Analysis: Width of Hair
- Calculate the value for each hair sample using equation # 4. Be sure to include sample calculations in your report.
- Calculate the width of each hair w for each sample using equation #5. Be sure to include sample calculations in your report. You are likely to have calculated your hair width, w, in nanometers. Convert and report your hair width to micrometers, µm. Hair width has surprising variation, but you should be able to report hair width in micrometers without exponential notation.
- You now have two width measurements for each hair sample. Report the % Difference of the width (w) originating from z1 and z2 for each hair sample. Analysis comparing different samples beyond width will not tell us much about our measurement and calculation precision. You will recall % difference from lab 1.
% difference = x 100 Equation 6
The following example data table may be helpful in collecting your calculation data. As always, include sample calculations in your report.
| Data Table 2: Hair Width Calculation | |
| Hair Sample 1 | Hair Sample 2 |
| Hair type (course/fine): | Hair type (course/fine): |
| : | : |
| w based on z1 with unit: | w based on z1 with unit: |
| w based on z2 with unit: | w based on z2 with unit: |
| w based on z1 µm: | w based on z1 µm: |
| w based on z2 µm: | w based on z2 µm: |
| % Difference 1: | % Difference 2: |
Post Lab Questions
- If you used a green laser pointer in place of red, what would happen to?
- If the color of a silver nanoparticle solution remains constant, what can you infer about the aggregation of silver nanoparticles?
- Find the absorption peak absorbing at the shortest wavelength from part two of the lab, or from your spectrophotometric data. What is the amount of energy associated with the absorption of one photon of light in order to form this peak?
Conclusion
Discuss your findings from this experiment by addressing the following questions in paragraph form.
- Describe how you used your data to figure out the concentration of your unknown sample. Why and how did you use all of the prior data to find a single number?
Try to write this conclusion as if you were explaining this experiment to your Chem 101 self.
- a. Find a real-world application to finding the diameter or width of something small using the interaction with light. Do not use an example from this lab.
- Find a real-world application using a calibration curve in order to quantify an unknown. Do not use an example from this lab.
Your Report
- Complete the pre-lab and take the pre-lab quiz in Blackboard before attending lab.
- Use a lab notebook to record observations and make calculations.
- Create an informal lab document to turn in at the beginning of the next lab. Your lab report should include clearly labeled and tabulated or graphed raw data, any formulas or equations, unknown number, or letter (if applicable), conclusive data such as width, volume of an analyte, % error, etc. with clear example calculations or sample calculations*. Use graphs or tables where applicable. Discuss results relevant to your findings. Think about the main point of the lab, or the results that you worked for and be sure to include it or them. Refer to How to Write an Informal Lab Report as you write your report.
- Include numbered responses to any post lab questions. You do not need to re-write the questions but will use complete sentences or a short paragraph as appropriate. Be specific. If you describe an error, for example, you must describe the direction the data would skew and why.
- Submit your document before your next lab appointment under the assignment tab on your laboratory Blackboard shell. Please note: Lab two will take two weeks. Submit the lab prior to the start of lab three.
References:
Davila, R. In Lab 10: Spectrophotometry College of Southern Idaho; College of Southern Idaho; 2020.
Adapted From: Dieckmann, G., Sibert, J. In An Atoms First Approach to the General Chemistry Laboratory; McGraw Hill: New York, NY, 2015; pp 21–32.
Personal Communication: Vladimir Kitaev, First–Year Laboratory Experiment on Synthesis of Silver Nano prisms with variable size and Investigation of Their Optical Properties Andrew J. Frank, Nicole Cathcart, Kenneth E. Maly, Vladimir Kitaev* Department of Chemistry
Wilfrid Laurier University, Waterloo, Ontario, Canada, N2L3C5
Personal Communication: Dong Hee Son
DEPARTMENT OF CHEMISTRY TEXAS A&M UNIVERSITY Ver. 1.1 Materials in nanoscale: Size matters. Dong Hee Son
Wiley, B., Sun, Y., Xia, Y., Synthesis of Silver Nanostructures with Controlled Shapes and Properties. Acc. Chem. Res. 2007; 40: 1067-1076.
